

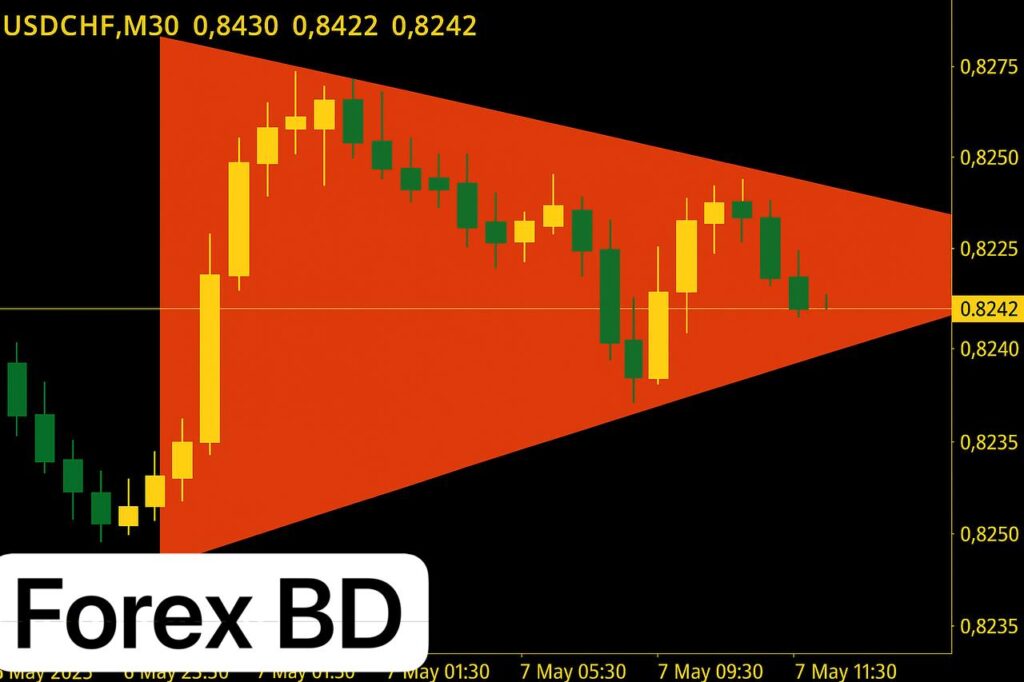
M30 চার্ট অনুযায়ী, USDCHF একটি Bearish Symmetrical Triangle pattern তৈরি করেছে। এই pattern ইঙ্গিত দেয় যে, যদি নিচের level 0.8211 ব্রেক করে, তাহলে মার্কেটে আরও downward trend যেতে পারে।
Pair: USDCHF
Timeframe: M30
Pattern: Bearish Symmetrical Triangle
Observation:
On the M30 chart, USDCHF has formed a Bearish Symmetrical Triangle pattern. This pattern typically indicates market indecision with progressively lower highs and higher lows, squeezing into a triangle shape. In most cases, this is considered a continuation pattern in the direction of the existing trend — and judging by the previous price action leading to this formation, it appears to follow a downward trend.
Key Levels:
• Upper Boundary (Resistance): Around 0.8275
• Lower Boundary (Support): Around 0.8211
• Current Price: 0.8242
Trading Idea:
• If price breaks below 0.8211, it would confirm a bearish breakout from the triangle pattern.